Financial Standing and Cash Flow
![]()
| (millions of yen) | 2022/3 | 2023/3 | 2024/3 | 2025/3 | 2026/3 |
|---|---|---|---|---|---|
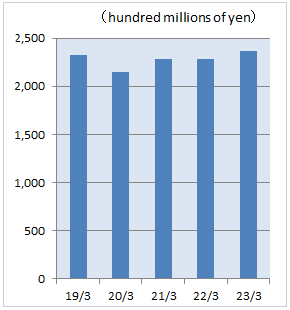
| Total assets | 228,159 | 237,105 | 266,494 | 268,448 | 286,820 |
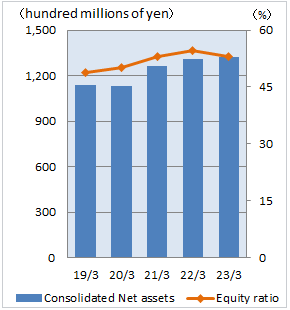
| Net assets | 130,788 | 131,992 | 151,562 | 156,486 | 170,232 |
| Net Income - Sharehoider's Equity Ratio |
5.9% | 6.3% | 11.6% | 7.6% | 10.1% |
| Ordinary Income - Total assets ratio |
4.7% | 5.6% | 7.9% | 7.5% | 8.9% |
| Operating Income - Net sales ratio |
4.5% | 5.4% | 6.2% | 6.5% | 8.2% |
| Equity capital ratio | 54.7% | 53.1% | 54.0% | 55.2% | 56.1% |
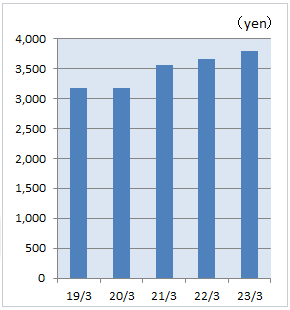
| Net assets per share | 1,829.27yen | 1,894.37yen | 2,194.04yen | 2,282.91yen | 2,555.19yen |
-
*A 2-for-1 share split of common shares was conducted on April 1, 2025.
Net assets per share before the fiscal year ended March 31, 2025, was calculated assuming that the stock split had been conducted
![]()
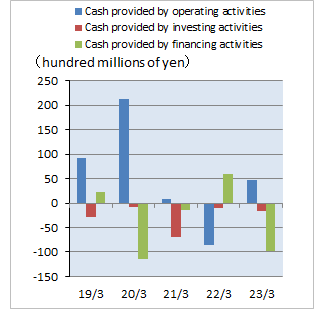
| Cash Flows | 2022/3 | 2023/3 | 2024/3 | 2025/3 | 2026/3 |
|---|---|---|---|---|---|
| Net cash provided by (used in) operating activities | -8,544 | 4,806 | 20,738 | -21,219 | 64,700 |
| Net cash provided by (used in) investing activities | -1,071 | -1,748 | 2,148 | -4,982 | 748 |
| Net cash provided by (used in) financing activities | 6,000 | -9,822 | -5,545 | 1,907 | -23,475 |
| Cash and cash equivalents at end of period | 48,791 | 43,946 | 63,265 | 42,013 | 86,359 |
-
Total assets
-
Net assets and Equity capital ratio
-
Net assets per share
-
Cash Flows